Free browser memory test. Allocates increasing typed arrays to graph heap growth against the browser memory limit, with live readings of used / total / limit heap from performance.memory (Chrome/Edge). Safe abort before OOM. Browser-based, no install.
Measures browser heap usage live via performance.memory on Chrome and Edge, and lets you allocate typed arrays in configurable 10 MB chunks to watch the heap grow toward its limit. On Firefox and Safari (which do not expose performance.memory), the tool falls back to allocation-count only. Safely aborts before OOM. Browser-based, no install.
Live heap stats
—Used heap (MB)
—Total heap (MB)
—Heap limit (MB)
0Allocated by test (MB)
—Used / limit (%)
Stress allocation
Safety: allocation auto-stops if used heap exceeds 85% of the browser's heap limit, or after 500 chunks, whichever comes first. On Firefox/Safari (no performance.memory), the test stops at 300 MB self-allocated as a safety cap.
Heap growth graph
Green line: used heap. Yellow: total heap. Red dashed: browser heap limit. Chart updates every 500 ms.
Was this tool helpful?Rate Memory Test:5.0(3 ratings)Thanks for rating!
Memory Test is a free, browser-based browser memory test.
Cost: Free, no signup
Install: None — runs in the browser
Privacy: Runs locally, no uploads
Platforms: Windows, macOS, Linux, Android, iOS
Time: Under a minute
How The Memory Test Works
On Chrome and Edge, the test reads the non-standard performance.memory API every 500 ms to pull three values: usedJSHeapSize (how much the current page is holding), totalJSHeapSize (how much the browser has reserved for this tab), and jsHeapSizeLimit (the hard ceiling the browser will enforce before terminating the tab). The allocator creates fresh Uint8Array typed arrays of the chosen chunk size and retains them in a local array so they cannot be garbage-collected. Writing one byte per 4 KB page guarantees the allocation is actually committed to memory rather than lazy-allocated. Firefox and Safari do not expose performance.memory, so the tool falls back to tracking only its own allocation total and caps the run at 300 MB.
What "Heap Limit" Actually Is
The heap limit is the browser's decision, not the operating system's. On 64-bit Chrome desktop the default is roughly 4 GB for the main thread's isolate, though this varies by build and memory pressure. On Chrome for Android the limit is much lower — typically 256-512 MB — because mobile devices prioritize killing tabs over letting one tab consume the entire system. The limit also differs between the main thread and Web Worker threads, and between regular tabs and Service Workers. This tool always reports the main thread's limit, which is the one that matters for the page you're looking at.
For laptop buyers, browser memory limits are only one part of the story. If your work also depends on GPU VRAM for games, AI tools, or creative apps, use our best laptops with good GPU guide alongside this memory test.
Detecting Memory Leaks In Web Apps
One of the genuinely useful uses of this page is leak detection. Load the app you suspect is leaking in a separate tab, come back here, and click Release & GC to baseline this tab at low usage. Then keep watching the Used heap while you exercise the suspect app (navigate between pages, open/close modals, do whatever action you think triggers the leak). If Used heap on the suspect tab keeps climbing and never drops after interaction, there is likely a detached DOM or lingering event-listener chain keeping allocations alive. The real leak hunt happens in Chrome DevTools Memory panel (heap snapshots), but this page is a quick "is there a problem here?" check.
This Is Not A Hardware RAM Stability Test
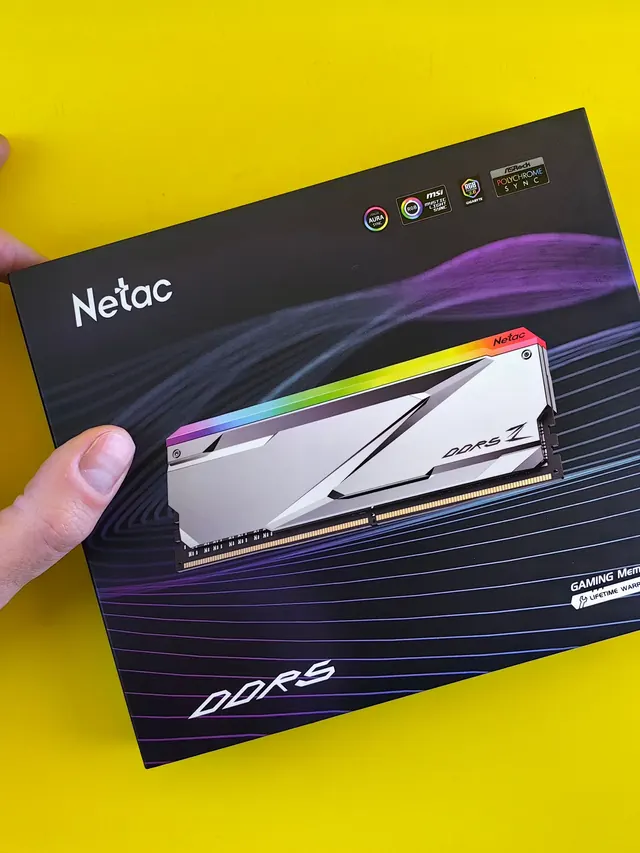
No JavaScript running in a browser tab can test RAM at the hardware level. The browser handles all allocation through an allocator and garbage collector, with explicit limits and page-level virtual-memory isolation. For real RAM stability testing — detecting bad DIMMs, validating an XMP profile, or verifying a DDR5 kit is stable — use a bootable tool that runs outside any OS: MemTest86, MemTest86+, or HCI MemTest when you need to test within Windows. Our browser-based test is useful for web-app heap diagnostics and browser-limit curiosity, not for answering "is my RAM dying?". And if you are choosing which DDR5 kit to buy in the first place, our CL30 vs CL36 buying-decision guide covers the real-nanosecond math and current prices.
If your question is about gaming upgrades rather than this tab's heap limit, use the PC Bottleneck Calculator for a separate CPU-GPU pairing estimate; it does not test physical RAM or diagnose memory leaks.
The heap limit is per-browser-tab, not per-system. Chrome desktop typically caps tabs at 4 GB regardless of whether you have 16 GB or 128 GB of system RAM, to prevent one tab from consuming the entire machine. Mobile browsers cap much lower (256-512 MB).
Is this a replacement for MemTest86?
No. This tool measures browser heap behavior, not hardware RAM stability. No JavaScript can access memory directly or test DIMM integrity. For real RAM testing (bad modules, XMP stability, overclock validation) use MemTest86 as a bootable USB, which runs outside any OS.
Why doesn't Firefox / Safari show heap stats?
performance.memory is a non-standard Chrome API. Firefox and Safari do not expose it to protect against memory-based fingerprinting. The tool falls back to tracking only what it has allocated itself, capped at 300 MB as a safety.
What does "Release & GC" actually do?
It drops all references to the allocated chunks, making them eligible for garbage collection. The browser's GC runs on its own schedule, usually within a few seconds. You should see Used heap drop without doing anything else. If it does not drop, the chunks were tenured into old-generation memory and the GC will reclaim them later.
01 / 10DDR5 buying mathPay $120 more for 2 nanoseconds?CL30 vs CL36 looks big on the box. The real difference is 2 nanoseconds.02 / 10What CL really isCAS latency counts cycles, not timeCL is how many clock ticks the RAM waits before answering. Ticks get faster with speed.03 / 10The one-line formulans = 2000 x CL / MT/sTrue latency in nanoseconds. DDR5-6000 CL30: 2000 x 30 / 6000 = 10.0 ns.04 / 10CL30 vs CL36 at 600010.0 ns versus 12.0 nsSame speed, different CL: the whole debate is about 2 nanoseconds of wait time.05 / 10The tie surprise7200 CL36 is also 10.0 nsSo is 6400 CL32. A higher CL on a faster kit can match a lower CL exactly.06 / 10What 2 ns buys in gamesRoughly 1-4% average FPSOnly when CPU-bound, and benchmarks disagree. Smoother 1% lows are the steadier win.07 / 10Price check, Aug 11, 2026The CL30 premium: $120G.Skill CL30 $599.99 vs CL36 $479.99. A Patriot CL30 kit: $429.99. Shop across brands.08 / 10The EXPO/XMP gotchaYour CL30 may be running CL40Kits boot at JEDEC defaults until you enable EXPO or XMP in BIOS. Check yours today.09 / 10The X3D exceptionBig cache blunts CLOn 7800X3D-class CPUs, the stacked cache blunts CL gains. Buy CL36 and save.10 / 10The verdictSmall delta: yes. Upgrade: no.Compare your two kits in real nanoseconds - presets loaded, math done for you.
01 / 10Phone vibration testYour phone stopped buzzingBefore you book a repair, find out whether it is the motor or just a setting.02 / 10The symptomMissed calls and silent alertsA dead motor is easy to miss. You only notice the calls you never felt arrive.03 / 10What is insideA tiny weight on a motorMost phones spin an offset weight or drive a linear actuator to make the buzz.04 / 10Check this firstSettings fake a dead motorSilent mode, Do Not Disturb and per-app vibration all switch the buzz off.05 / 10Run the testOne tap, three patternsThe browser asks the phone to vibrate in short, long and pulsed patterns.06 / 10Result: weakYou feel it, but barelyA faint buzz often means a loose motor mount or a case damping the vibration.07 / 10Result: nothingNo buzz on any patternWith settings ruled out, silence points at the motor or its connector.08 / 10Result: on and offIt works, then it does notIntermittent buzzing usually means a failing solder joint or a worn motor.09 / 10One honest limitiPhones cannot run this testSafari on iOS does not support the browser vibration API, so use Android.10 / 10Your turnFind out in thirty secondsRun the three patterns, then decide whether it is a setting or the hardware.